
Making spatial analysis accessible through ordinary questions
Start with the question
Spatial work often begins in plain language: what is near this site, which areas meet these conditions, how do two patterns overlap? Answering usually means a chain of specialist tools, data preparation, SQL, and map configuration.
Marauders approaches the gap from the question itself. Its public product experience combines a natural-language panel with a map workspace, so people can explore geospatial data directly.
What the interface does
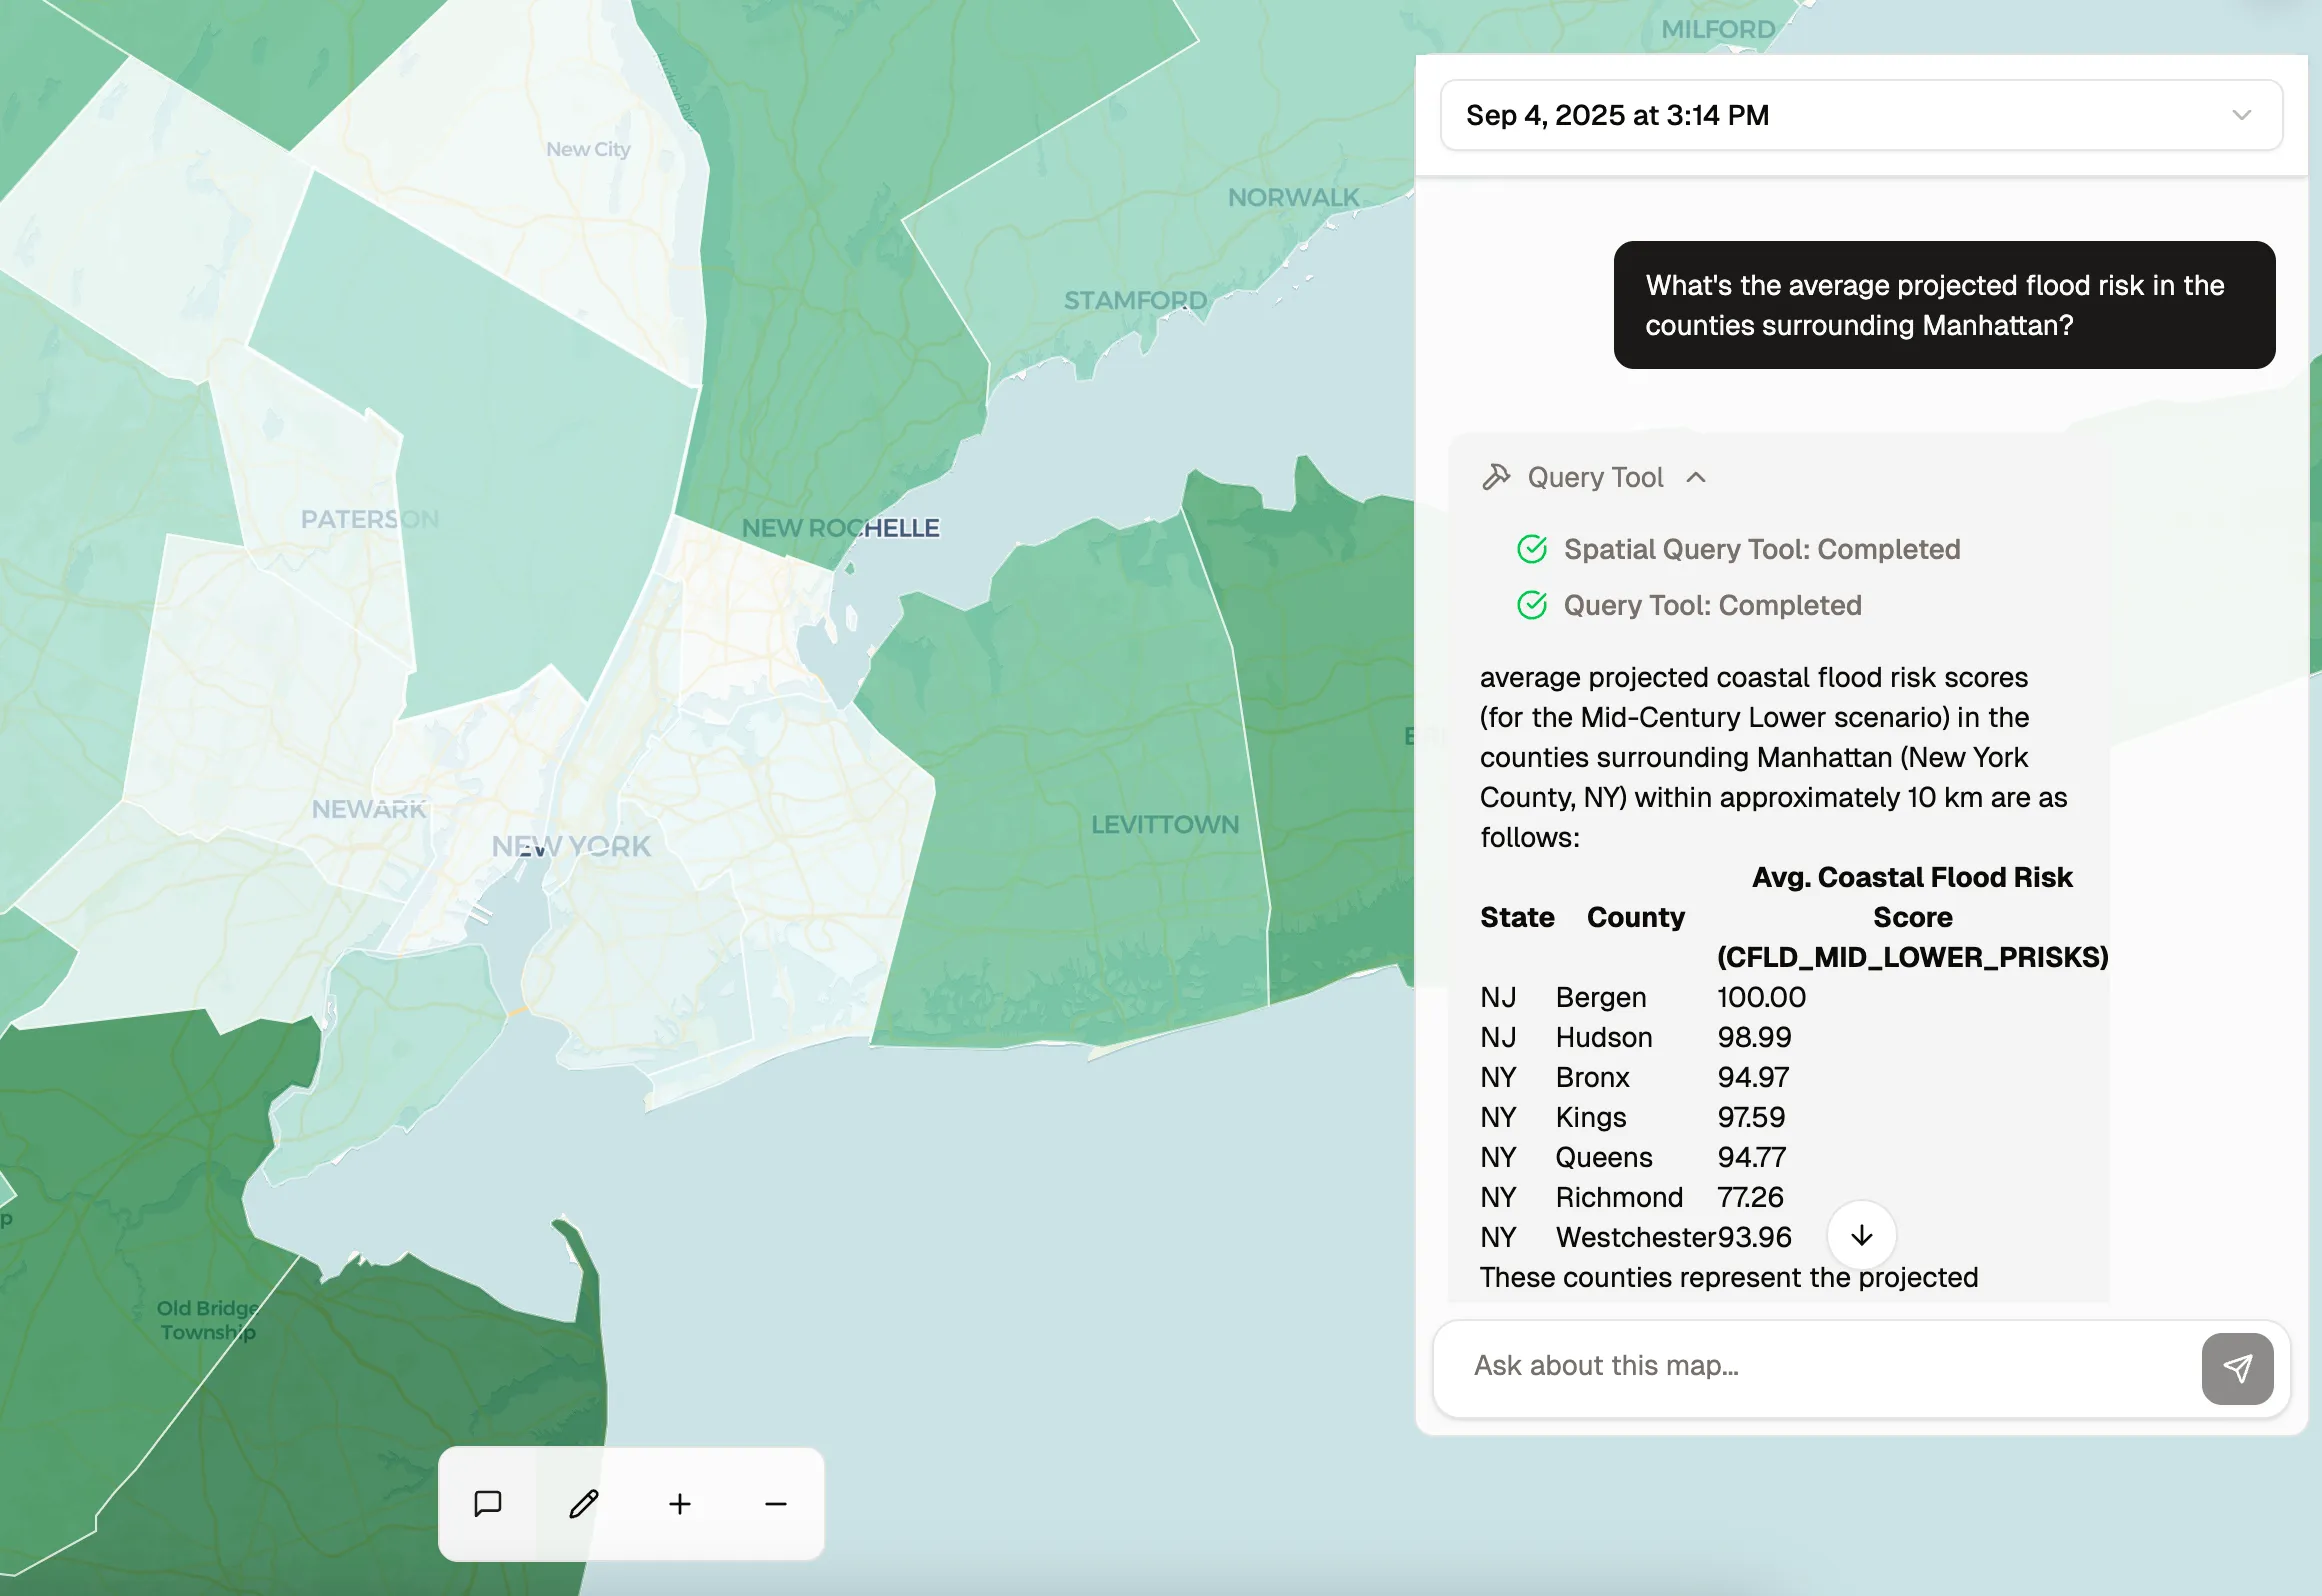
In the product, a user can ask “What’s the average projected flood risk in the counties surrounding Manhattan?” The Query Tool runs the spatial query and returns a table of average projected coastal flood risk scores for the surrounding counties under a mid-century scenario. The map shows the same counties shaded by score.
The same panel drives the map itself. Asking “Turn this into a heatmap of wind power plants” makes the Map Visualization Tool restyle the power-plants layer as a heatmap weighted by capacity, without leaving the conversation.
Why the pairing matters
The conversation provides an approachable point of entry; the map keeps the answer connected to geography. A number in a table is easier to trust when the user can see the counties it came from.
Related work
Tell us where the current process breaks down.
Show us the current process and the records people trust.