
In many plants the weekly operations report is a person. Someone exports production orders and shipments from the ERP on Monday morning, opens the shift spreadsheets each line lead keeps, copies the utility meter readings off a portal or a clipboard, and pastes it all into a workbook that only they fully understand. The report goes out by midday if nothing breaks.
That arrangement works until the person is out, a column moves in an export, or the plant manager and the controller bring different scrap numbers to the same meeting. It also caps what the business can ask. Nobody has time to look at last quarter by shift and product family when assembling this week took half a day.
This article describes the order we recommend for replacing the hand-built report at a manufacturer with roughly 50 to 500 staff. The sequence matters more than the tools. A central database comes first, then definitions people agree on, then scheduled loads and dashboards. Forecasting and plain-language querying come last, because they inherit every flaw in what sits underneath them.
Map the report you already have
Start with the current report, line by line. For each number, write down where it comes from, who touches it, what manual step turns the raw export into the figure on the page, and who would notice if it were wrong.
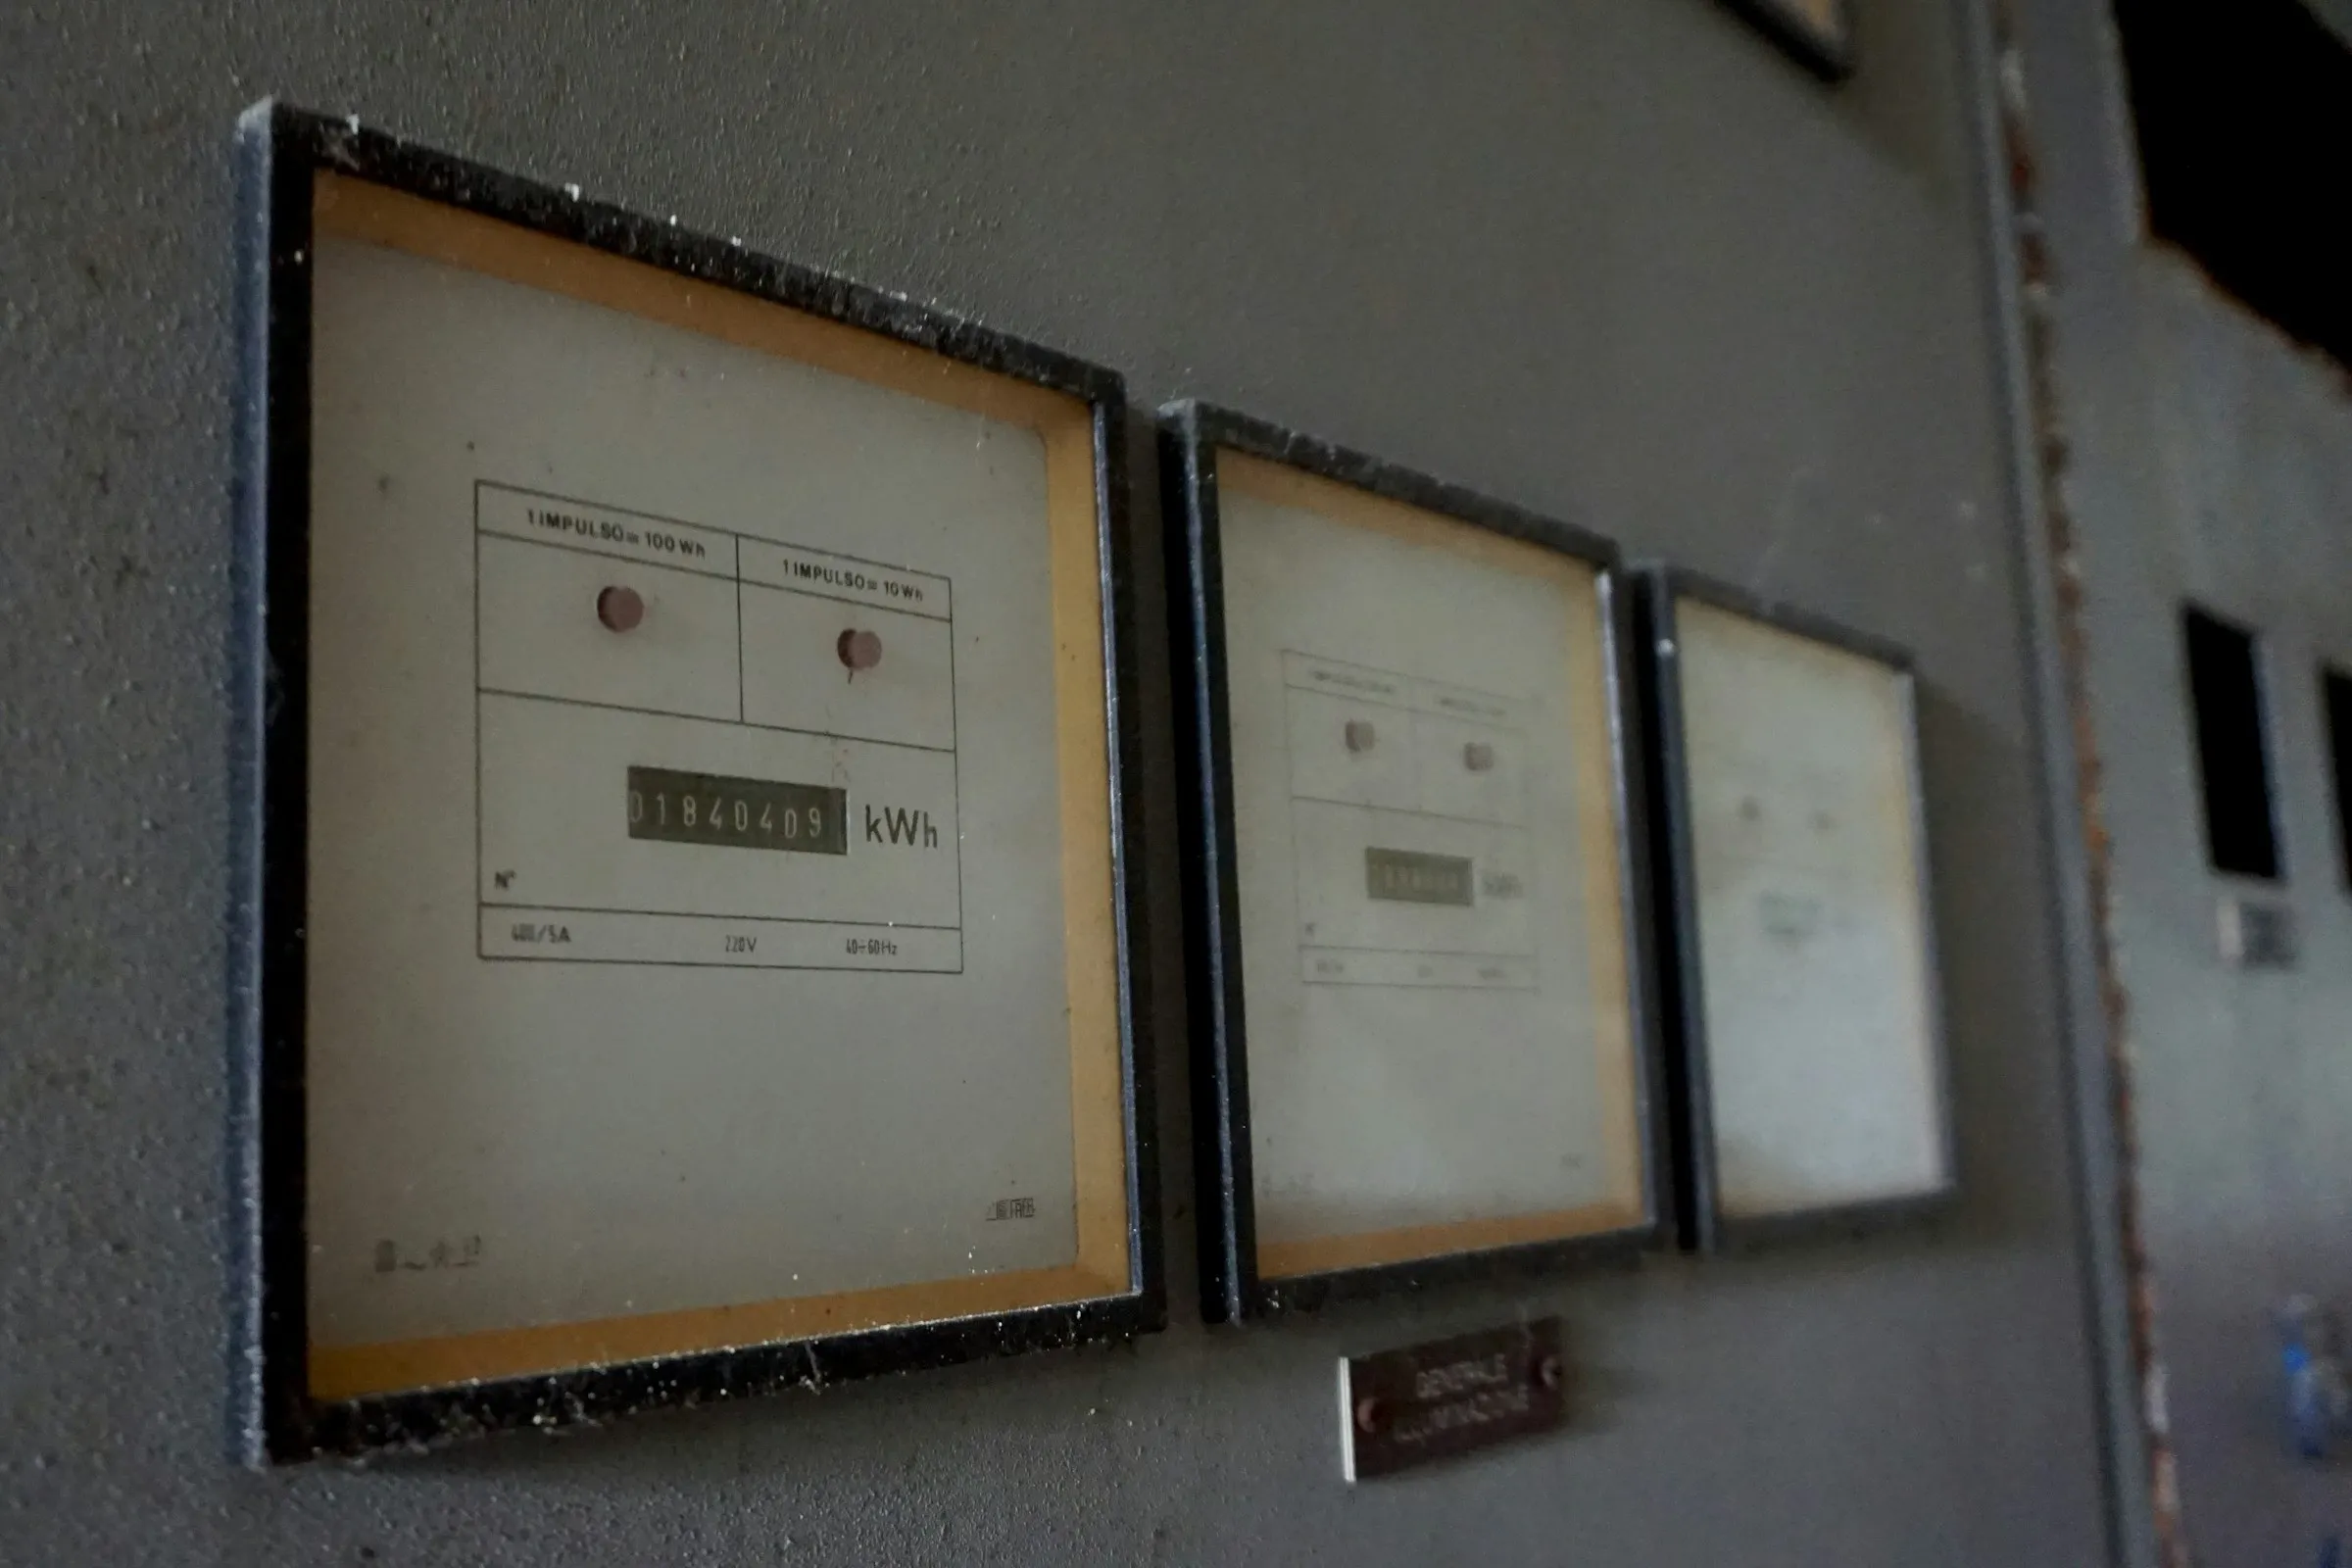
The sources usually sort themselves out quickly. The ERP holds orders, receipts, inventory, labor and cost. Plant spreadsheets hold what the ERP does not see well, such as downtime reasons, changeover times, rework and line-level counts. Meters and utility bills hold electricity, gas, compressed air or water use. Some sites also have a SCADA system or data historian with machine-level signals.
The mapping exercise often surfaces quiet problems. Two lines may log downtime in different units. A spreadsheet may have a hidden tab with a hardcoded correction from 2023. The ERP export may be run with a filter that only one person remembers to set. Record these as you go, because each one becomes either a transformation rule or a question for the owner.
Build one database before any dashboard
The temptation is to point a dashboard tool straight at the ERP and the spreadsheets. It produces something quickly, and then every report re-implements the same joins and corrections in its own way. The disagreement over numbers moves from workbooks into dashboards.
A central database gives each source one landing place and one set of cleaning rules. For a mid-sized plant this rarely needs to be large or expensive. A managed relational database or a modest cloud warehouse handles years of production and meter history comfortably. When we built a retail data lake for Additech, transaction files landed in Amazon S3 as Parquet and were queried with Athena, with QuickSight dashboards on top. The same pattern of raw files plus a query layer suits manufacturers whose volumes are higher than their budgets.
The gap here is common. A July 2026 Kaufman Rossin summary of its State of AI in the Mid-Market report [1] says “only 27% of manufacturing companies surveyed have a data warehouse or data lake, compared with 60% across the broader mid-market.” The same page says manufacturers named “legacy ERP systems and siloed data as the top barriers, cited by 55% of manufacturers, well above the 41% market average.” The page does not state the sample size or how the firm defines the mid-market, so treat these as one advisory firm’s survey results.
Agree on definitions in writing
Most arguments about plant numbers are arguments about definitions. Before anyone builds a chart, the plant manager, the controller and the operations lead should sign off on a short glossary for the metrics that drive decisions.
Overall equipment effectiveness is the usual starting point. The Lean Enterprise Institute [2] defines it as availability rate × performance rate × quality rate, where availability captures downtime from failures and adjustments as a share of scheduled time, performance captures running below design speed and short stoppages, and quality captures scrap and rework as a share of total parts run. Its worked example of 90%, 95% and 99% gives an OEE of 84.6%.
The formula is settled. The inputs are where plants differ. A useful glossary entry answers the questions that cause disagreement:
| Metric | Questions to settle |
|---|---|
| OEE | Is planned maintenance excluded from scheduled time? What is the design speed for each product on each line? Do reworked parts count as good? |
| Scrap rate | Measured by units, weight or cost? Counted at the station or at final inspection? Does supplier-caused scrap count? |
| Energy intensity | Which meters roll up to which line or building? Is the denominator good units, total units or tons shipped? How are shared loads such as compressed air and HVAC allocated? |
| Labor productivity | Paid hours or worked hours? Are temporary staff included? |
Write each definition next to the SQL or transformation that computes it, and give each one an owner. When someone later asks why the dashboard disagrees with their spreadsheet, the answer should take minutes to find.
Load on a schedule and watch the loads
Once definitions exist, each source gets an automated load into the database. ERP data can usually be pulled through the vendor’s API, a reporting database or a scheduled export to a shared folder. Plant spreadsheets are the hardest source, and often the right move is to replace the most important ones with a simple structured template or form so that a load can read them without guessing. Meter data may arrive from a utility portal, a building management system or a historian.
Match the schedule to the decision. A weekly review needs a nightly load at most. A morning production meeting needs data that landed overnight. Few plants at this size need minute-level refresh for management reporting.
Loads fail, and silent failure is worse than a late report. Each load should record when it ran, how many rows arrived and whether the counts look plausible against the previous run. Power BI’s own scheduled refresh documentation [3] shows why this matters downstream. It limits Power BI Pro to 8 scheduled refreshes per day and Premium or Fabric capacity to 48, deactivates a refresh schedule after four consecutive failures, and pauses scheduled refresh after two months in which nobody views a report built on the model. On-premises sources such as a plant file server need a data gateway to refresh.
New York manufacturers who want better meter coverage should check NYSERDA’s current offerings. Its Real Time Energy Management industrial fact sheet [4], dated December 2019, described a cost share of up to 30% of RTEM expenses, capped at $500,000, including integration with existing SCADA systems and data historians. The RTEM solicitation, PON 3689 [5], is now listed as closed. Confirm with NYSERDA whether a successor program applies before counting on that funding.
Put dashboards in the tool people already open
If the finance team lives in Power BI and the plant manager reads email on a phone, build there. A new tool adds licenses, logins and training for a problem that is mostly about data.
Start by rebuilding the existing weekly report from the database, matching its layout closely enough that people can compare old and new side by side for a few weeks. Run both in parallel and reconcile every difference. Most differences will trace back to a manual correction that someone has been making for years, and each one should either become a documented rule or be dropped on purpose.
Only after the parallel run should the report change shape. Typical next steps are drill-downs by line, shift and product family, a daily view for the morning meeting, and an energy view that sets kilowatt-hours per good unit next to OEE so that the operations lead can see whether a slow line is also an expensive one.
Add forecasting and plain-language questions last
Forecasting and natural-language querying are reasonable goals for a plant with a working data layer. They are poor first projects. A demand or maintenance forecast trained on inconsistent downtime codes will learn the inconsistency.
ERP vendors have started offering plain-language access to their own data. Oracle’s NetSuite AI Connector Service [6] lets an external AI client “query data using natural language,” run reports and saved searches, and execute read-only SuiteQL, with queries limited by the user’s NetSuite role. That is useful for questions the ERP alone can answer. Questions a plant manager actually asks, such as energy per unit by line last month, need ERP orders joined to plant counts and meter readings under the agreed definitions. That join is the work this article describes, and it has to exist before a language model can answer the question reliably.
The same order applies to predictive work. For a utility client, we built models that ranked which equipment warranted inspection first, and they depended on combining equipment history, sensor data and location context that had previously sat apart.
When not to automate
Automation is not always worth it. A report that one person assembles in 30 minutes, that nobody disputes, and that rarely changes may not justify a database and pipelines that someone must maintain.
Hold off if the underlying process is about to change, for example during an ERP migration or a line reconfiguration. Definitions written now will need rewriting. Hold off if no one internally will own the glossary and respond when a load fails, unless you plan to pay someone to do it. And be wary of automating a spreadsheet whose numbers are typed in after the fact from memory. A pipeline will deliver those numbers faster without making them more accurate. Fix the capture at the line first. If your weekly report still depends on exports and copy-paste, see how we approach automated reporting and data platforms.
Sources
This sequence is our synthesis of public guidance and our own project work. No client outcomes are claimed here beyond what our published case studies describe.